National Solar
Disclaimer
Overview
National Solar is a national digital dataset representing photovoltaic solar panel information for each state and territory of Australia. The National Solar dataset has relationships with the Buildings and G-NAF products produced by Geoscape Australia.
Geoscape Australia welcomes your feedback on the National Solar product. We also publish regular product development updates on our website (www.geoscape.com.au).
Release Summary
This product was released to customers on 30 June 2026 with data extracted on 24 June 2026.
This release is a full national data population for Version 1.3 of the National Solar product, described by the National Solar Product Guide v1.3.
Any issues that have been identified for this release are described in the Issues section.
This release includes updates for the areas listed in the table below.
Locations of updated areas by State
State |
Location |
Urban Area (km2) |
|---|---|---|
ACT |
Australian Capital Territory |
503 |
NSW |
Albury City Council |
9 |
NSW |
Armidale Regional Council |
29 |
NSW |
Ballina Shire Council |
10 |
NSW |
Balranald Shire Council |
14 |
NSW |
Bathurst Regional Council |
38 |
NSW |
Bayside Council |
51 |
NSW |
Bega Valley Shire Council |
90 |
NSW |
Bellingen Shire Council |
34 |
NSW |
Berrigan Shire Council |
33 |
NSW |
Blacktown City Council |
124 |
NSW |
Bland Shire Council |
45 |
NSW |
Blayney Shire Council |
29 |
NSW |
Blue Mountains City Council |
21 |
NSW |
Bogan Shire Council |
19 |
NSW |
Bourke Shire Council |
17 |
NSW |
Brewarrina Shire Council |
12 |
NSW |
Burwood Council |
7 |
NSW |
Byron Shire Council |
17 |
NSW |
Cabonne Shire Council |
79 |
NSW |
Campbelltown City Council |
4 |
NSW |
Canterbury-Bankstown Council |
108 |
NSW |
Carrathool Shire Council |
28 |
NSW |
Central Coast Council |
281 |
NSW |
Central Darling Shire Council |
17 |
NSW |
Cessnock City Council |
20 |
NSW |
City of Canada Bay Council |
20 |
NSW |
City of Parramatta Council |
84 |
NSW |
Clarence Valley Council |
90 |
NSW |
Cobar Shire Council |
19 |
NSW |
Coffs Harbour City Council |
14 |
NSW |
Coolamon Shire Council |
25 |
NSW |
Coonamble Shire Council |
31 |
NSW |
Cootamundra-Gundagai Regional Council |
44 |
NSW |
Council of the City of Sydney |
26 |
NSW |
Cowra Shire Council |
39 |
NSW |
Cumberland Council |
72 |
NSW |
Dubbo Regional Council |
82 |
NSW |
Dungog Shire Council |
30 |
NSW |
Edward River Council |
36 |
NSW |
Eurobodalla Shire Council |
48 |
NSW |
Fairfield City Council |
45 |
NSW |
Federation Council |
40 |
NSW |
Forbes Shire Council |
44 |
NSW |
Georges River Council |
42 |
NSW |
Gilgandra Shire Council |
30 |
NSW |
Glen Innes Severn Shire Council |
41 |
NSW |
Goulburn Mulwaree Council |
32 |
NSW |
Greater Hume Shire Council |
61 |
NSW |
Griffith City Council |
23 |
NSW |
Gunnedah Shire Council |
52 |
NSW |
Gwydir Shire Council |
49 |
NSW |
Hawkesbury City Council |
147 |
NSW |
Hay Shire Council |
13 |
NSW |
Hilltops Council |
91 |
NSW |
Inner West Council |
35 |
NSW |
Inverell Shire Council |
69 |
NSW |
Junee Shire Council |
23 |
NSW |
Kempsey Shire Council |
40 |
NSW |
Ku-ring-gai Council |
62 |
NSW |
Kyogle Council |
46 |
NSW |
Lachlan Shire Council |
50 |
NSW |
Lake Macquarie City Council |
1 |
NSW |
Lane Cove Municipal Council |
10 |
NSW |
Leeton Shire Council |
31 |
NSW |
Lismore City Council |
46 |
NSW |
Lithgow City Council |
32 |
NSW |
Liverpool City Council |
46 |
NSW |
Liverpool Plains Shire Council |
44 |
NSW |
Lockhart Shire Council |
25 |
NSW |
Mid-Coast Council |
197 |
NSW |
Mid-Western Regional Council |
103 |
NSW |
Moree Plains Shire Council |
70 |
NSW |
Mosman Municipal Council |
9 |
NSW |
Murray River Council |
51 |
NSW |
Murrumbidgee Council |
27 |
NSW |
Muswellbrook Shire Council |
32 |
NSW |
Nambucca Valley Council |
44 |
NSW |
Narrabri Shire Council |
67 |
NSW |
Narrandera Shire Council |
28 |
NSW |
Narromine Shire Council |
34 |
NSW |
North Sydney Council |
10 |
NSW |
Northern Beaches Council |
88 |
NSW |
Oberon Council |
30 |
NSW |
Orange City Council |
8 |
NSW |
Parkes Shire Council |
39 |
NSW |
Penrith City Council |
114 |
NSW |
Port Macquarie-Hastings Council |
96 |
NSW |
Port Stephens Council |
10 |
NSW |
Queanbeyan-Palerang Regional Council |
156 |
NSW |
Randwick City Council |
35 |
NSW |
Richmond Valley Council |
54 |
NSW |
Ryde City Council |
41 |
NSW |
Shellharbour City Council |
1 |
NSW |
Shoalhaven City Council |
98 |
NSW |
Singleton Council |
47 |
NSW |
Snowy Monaro Regional Council |
94 |
NSW |
Snowy Valleys Council |
56 |
NSW |
Strathfield Municipal Council |
14 |
NSW |
Sutherland Shire Council |
82 |
NSW |
Tamworth Regional Council |
96 |
NSW |
Temora Shire Council |
29 |
NSW |
Tenterfield Shire Council |
40 |
NSW |
The Council of the Municipality of Hunters Hill |
6 |
NSW |
The Council of the Municipality of Kiama |
9 |
NSW |
The Council of the Shire of Hornsby |
49 |
NSW |
The Hills Shire Council |
70 |
NSW |
Tweed Shire Council |
44 |
NSW |
Unincorporated - Far West Area |
16 |
NSW |
Unincorporated - Lord Howe Island |
1 |
NSW |
Unincorporated - Sydney Harbour Area |
25 |
NSW |
Upper Hunter Shire Council |
66 |
NSW |
Upper Lachlan Shire Council |
66 |
NSW |
Uralla Shire Council |
29 |
NSW |
Wagga Wagga City Council |
40 |
NSW |
Walcha Council |
24 |
NSW |
Walgett Shire Council |
51 |
NSW |
Warren Shire Council |
23 |
NSW |
Warrumbungle Shire Council |
69 |
NSW |
Waverley Council |
9 |
NSW |
Weddin Shire Council |
28 |
NSW |
Wentworth Shire Council |
25 |
NSW |
Willoughby City Council |
22 |
NSW |
Wingecarribee Shire Council |
54 |
NSW |
Wollondilly Shire Council |
6 |
NSW |
Woollahra Municipal Council |
12 |
NSW |
Yass Valley Council |
51 |
NT |
Alice Springs Municipality |
1 |
NT |
Barkly Region |
17 |
NT |
Central Desert Region |
10 |
NT |
Coomalie Shire |
8 |
NT |
East Arnhem Region |
9 |
NT |
Groote Archipelago Region |
3 |
NT |
Katherine Municipality |
13 |
NT |
Litchfield Municipality |
24 |
NT |
MacDonnell Region |
16 |
NT |
Roper Gulf Region |
15 |
NT |
Tiwi Islands Region |
3 |
NT |
Un-Incorporated (Alyangula) Area |
1 |
NT |
Un-Incorporated (Cox-Daly) Area |
10 |
NT |
Un-Incorporated (Marrakai-Douglas Daly) Area |
8 |
NT |
Un-Incorporated (Nhulunbuy) Area |
3 |
NT |
Un-Incorporated (Yulara) Area |
2 |
NT |
Victoria Daly Region |
14 |
NT |
Wagait Shire |
2 |
NT |
West Arnhem Region |
10 |
NT |
West Daly Region |
4 |
QLD |
Aurukun Shire |
1 |
QLD |
Balonne Shire |
29 |
QLD |
Banana Shire |
76 |
QLD |
Barcaldine Regional |
23 |
QLD |
Barcoo Shire |
5 |
QLD |
Blackall Tambo Regional |
14 |
QLD |
Boulia Shire |
4 |
QLD |
Brisbane City |
3 |
QLD |
Bulloo Shire |
5 |
QLD |
Bundaberg Regional |
112 |
QLD |
Burdekin Shire |
46 |
QLD |
Burke Shire |
4 |
QLD |
Cairns Regional |
175 |
QLD |
Carpentaria Shire |
7 |
QLD |
Cassowary Coast Regional |
82 |
QLD |
Central Highlands Regional |
90 |
QLD |
Charters Towers Regional |
52 |
QLD |
Cherbourg Aboriginal Shire |
1 |
QLD |
Cloncurry Shire |
13 |
QLD |
Cook Shire |
21 |
QLD |
Croydon Shire |
2 |
QLD |
Diamantina Shire |
2 |
QLD |
Doomadgee Aboriginal Shire |
1 |
QLD |
Douglas Shire |
28 |
QLD |
Etheridge Shire |
9 |
QLD |
Flinders Shire |
14 |
QLD |
Fraser Coast Regional |
83 |
QLD |
Gladstone Regional |
90 |
QLD |
Gold Coast City |
7 |
QLD |
Goondiwindi Regional |
57 |
QLD |
Gympie Regional |
108 |
QLD |
Hinchinbrook Shire |
37 |
QLD |
Hope Vale Aboriginal Shire |
2 |
QLD |
Ipswich City |
55 |
QLD |
Isaac Regional |
79 |
QLD |
Kowanyama Aboriginal Shire |
1 |
QLD |
Livingstone Shire |
53 |
QLD |
Lockhart River Aboriginal Shire |
1 |
QLD |
Lockyer Valley Regional |
30 |
QLD |
Longreach Regional |
19 |
QLD |
Mackay Regional |
126 |
QLD |
Mapoon Aboriginal Shire |
1 |
QLD |
Maranoa Regional |
74 |
QLD |
Mareeba Shire |
82 |
QLD |
McKinlay Shire |
10 |
QLD |
Moreton Bay City |
63 |
QLD |
Mornington Shire |
1 |
QLD |
Mount Isa City |
5 |
QLD |
Murweh Shire |
19 |
QLD |
Napranum Aboriginal Shire |
1 |
QLD |
Noosa Shire |
18 |
QLD |
North Burnett Regional |
70 |
QLD |
Northern Peninsula Area Regional |
3 |
QLD |
Palm Island Aboriginal Shire |
1 |
QLD |
Paroo Shire |
14 |
QLD |
Pormpuraaw Aboriginal Shire |
1 |
QLD |
Quilpie Shire |
9 |
QLD |
Redland City |
19 |
QLD |
Richmond Shire |
8 |
QLD |
Rockhampton Regional |
60 |
QLD |
Scenic Rim Regional |
104 |
QLD |
Somerset Regional |
81 |
QLD |
South Burnett Regional |
139 |
QLD |
Southern Downs Regional |
113 |
QLD |
Sunshine Coast Regional |
24 |
QLD |
Tablelands Regional |
100 |
QLD |
Toowoomba Regional |
180 |
QLD |
Torres Shire |
4 |
QLD |
Torres Strait Island Regional |
6 |
QLD |
Townsville City |
155 |
QLD |
Weipa Town |
4 |
QLD |
Western Downs Regional |
173 |
QLD |
Whitsunday Regional |
84 |
QLD |
Winton Shire |
10 |
QLD |
Woorabinda Aboriginal Shire |
1 |
QLD |
Yarrabah Aboriginal Shire |
2 |
SA |
Adelaide Hills Council |
55 |
SA |
Adelaide Plains Council |
19 |
SA |
Alexandrina Council |
57 |
SA |
Anangu Pitjantjatjara Yankunytjatjara |
7 |
SA |
Barunga West Council |
16 |
SA |
City of Onkaparinga |
26 |
SA |
City of Playford |
5 |
SA |
City of Port Lincoln |
17 |
SA |
City of Salisbury |
3 |
SA |
City of Victor Harbor |
7 |
SA |
Clare and Gilbert Valleys Council |
43 |
SA |
Coorong District Council |
41 |
SA |
Copper Coast Council |
17 |
SA |
DC of Elliston |
12 |
SA |
DC of Robe |
8 |
SA |
Kangaroo Island Council |
29 |
SA |
Kingston DC |
13 |
SA |
Light Regional Council |
37 |
SA |
Lower Eyre Council |
33 |
SA |
Maralinga Tjarutja |
1 |
SA |
Mid Murray Council |
61 |
SA |
Mount Barker District Council |
47 |
SA |
Municipal Council of Roxby Downs |
4 |
SA |
Naracoorte Lucindale Council |
40 |
SA |
Northern Areas Council |
32 |
SA |
Pastoral Unincorporated Area |
47 |
SA |
Port Augusta City Council |
3 |
SA |
Port Pirie Regional Council |
33 |
SA |
Renmark Paringa Council |
26 |
SA |
Southern Mallee DC |
19 |
SA |
Tatiara DC |
41 |
SA |
The Barossa Council |
57 |
SA |
The Berri Barmera Council |
17 |
SA |
The DC of Ceduna |
15 |
SA |
The DC of Cleve |
17 |
SA |
The DC of Coober Pedy |
6 |
SA |
The DC of Franklin Harbour |
7 |
SA |
The DC of Grant |
23 |
SA |
The DC of Karoonda East Murray |
14 |
SA |
The DC of Kimba |
12 |
SA |
The DC of Loxton Waikerie |
51 |
SA |
The DC of Mount Remarkable |
23 |
SA |
The DC of Orroroo Carrieton |
9 |
SA |
The DC of Peterborough |
8 |
SA |
The DC of Streaky Bay |
16 |
SA |
The DC of Tumby Bay |
18 |
SA |
The DC of Yankalilla |
23 |
SA |
The Flinders Ranges Council |
9 |
SA |
The Regional Council of Goyder |
37 |
SA |
The Rural City of Murray Bridge |
27 |
SA |
Wakefield Regional Council |
38 |
SA |
Wattle Range Council |
48 |
SA |
Wudinna District Council |
14 |
SA |
Yorke Peninsula Council |
64 |
TAS |
Break O’Day Council |
22 |
TAS |
Brighton Council |
4 |
TAS |
Burnie City Council |
11 |
TAS |
Central Coast Council |
17 |
TAS |
Central Highlands Council |
21 |
TAS |
Circular Head Council |
28 |
TAS |
Clarence City Council |
7 |
TAS |
Derwent Valley Council |
23 |
TAS |
Devonport City Council |
5 |
TAS |
Dorset Council |
27 |
TAS |
Flinders Council |
7 |
TAS |
George Town Council |
16 |
TAS |
Glamorgan-Spring Bay Council |
21 |
TAS |
Glenorchy City Council |
3 |
TAS |
Hobart City Council |
3 |
TAS |
Huon Valley Council |
52 |
TAS |
Kentish Council |
25 |
TAS |
King Island Council |
9 |
TAS |
Kingborough Council |
25 |
TAS |
Latrobe Council |
18 |
TAS |
Launceston City Council |
18 |
TAS |
Meander Valley Council |
43 |
TAS |
Northern Midlands Council |
32 |
TAS |
Sorell Council |
11 |
TAS |
Southern Midlands Council |
30 |
TAS |
Tasman Council |
14 |
TAS |
Waratah-Wynyard Council |
22 |
TAS |
West Coast Council |
10 |
TAS |
West Tamar Council |
31 |
VIC |
Alpine Shire |
42 |
VIC |
Ararat Rural City |
50 |
VIC |
Ballarat City |
22 |
VIC |
Bass Coast Shire |
66 |
VIC |
Baw Baw Shire |
91 |
VIC |
Benalla Rural City |
35 |
VIC |
Buloke Shire |
48 |
VIC |
Campaspe Shire |
96 |
VIC |
Cardinia Shire |
67 |
VIC |
Casey City |
7 |
VIC |
Central Goldfields Shire |
38 |
VIC |
Colac Otway Shire |
71 |
VIC |
Corangamite Shire |
81 |
VIC |
East Gippsland Shire |
135 |
VIC |
Falls Creek Alpine Resort (Unincorporated) |
1 |
VIC |
French-Elizabeth-Sandstone Islands (Uninc) |
2 |
VIC |
Gannawarra Shire |
48 |
VIC |
Glenelg Shire |
57 |
VIC |
Golden Plains Shire |
88 |
VIC |
Greater Bendigo City |
71 |
VIC |
Greater Geelong City |
271 |
VIC |
Greater Shepparton City |
54 |
VIC |
Hepburn Shire |
56 |
VIC |
Hindmarsh Shire |
38 |
VIC |
Horsham Rural City |
36 |
VIC |
Hume City |
11 |
VIC |
Indigo Shire |
49 |
VIC |
Latrobe City |
60 |
VIC |
Loddon Shire |
62 |
VIC |
Macedon Ranges Shire |
88 |
VIC |
Mansfield Shire |
45 |
VIC |
Melton City |
11 |
VIC |
Mildura Rural City |
103 |
VIC |
Mitchell Shire |
64 |
VIC |
Moira Shire |
93 |
VIC |
Moorabool Shire |
60 |
VIC |
Mornington Peninsula Shire |
22 |
VIC |
Mount Alexander Shire |
60 |
VIC |
Mount Buller Alpine Resort (Unincorporated) |
1 |
VIC |
Mount Hotham Alpine Resort (Unincorporated) |
1 |
VIC |
Moyne Shire |
88 |
VIC |
Murrindindi Shire |
64 |
VIC |
Nillumbik Shire |
12 |
VIC |
Northern Grampians Shire |
53 |
VIC |
Pyrenees Shire |
49 |
VIC |
Queenscliffe Borough |
5 |
VIC |
South Gippsland Shire |
115 |
VIC |
Southern Grampians Shire |
74 |
VIC |
Strathbogie Shire |
53 |
VIC |
Surf Coast Shire |
64 |
VIC |
Swan Hill Rural City |
65 |
VIC |
Towong Shire |
34 |
VIC |
Wangaratta Rural City |
60 |
VIC |
Warrnambool City |
5 |
VIC |
Wellington Shire |
134 |
VIC |
West Wimmera Shire |
38 |
VIC |
Whittlesea City |
3 |
VIC |
Wodonga City |
8 |
VIC |
Wyndham City |
1 |
VIC |
Yarra Ranges Shire |
50 |
VIC |
Yarriambiack Shire |
49 |
WA |
City of Albany |
40 |
WA |
City of Armadale |
138 |
WA |
City of Bayswater |
34 |
WA |
City of Belmont |
39 |
WA |
City of Busselton |
32 |
WA |
City of Canning |
62 |
WA |
City of Cockburn |
137 |
WA |
City of Fremantle |
20 |
WA |
City of Gosnells |
98 |
WA |
City of Greater Geraldton |
25 |
WA |
City of Joondalup |
99 |
WA |
City of Kalamunda |
79 |
WA |
City of Kalgoorlie-Boulder |
46 |
WA |
City of Karratha |
12 |
WA |
City of Kwinana |
95 |
WA |
City of Mandurah |
91 |
WA |
City of Melville |
53 |
WA |
City of Nedlands |
20 |
WA |
City of Perth |
20 |
WA |
City of Rockingham |
168 |
WA |
City of South Perth |
20 |
WA |
City of Stirling |
105 |
WA |
City of Subiaco |
6 |
WA |
City of Swan |
222 |
WA |
City of Vincent |
11 |
WA |
City of Wanneroo |
238 |
WA |
Shire of Ashburton |
28 |
WA |
Shire of Augusta Margaret River |
47 |
WA |
Shire of Beverley |
17 |
WA |
Shire of Boddington |
11 |
WA |
Shire of Boyup Brook |
17 |
WA |
Shire of Bridgetown-Greenbushes |
24 |
WA |
Shire of Brookton |
10 |
WA |
Shire of Broome |
9 |
WA |
Shire of Broomehill-Tambellup |
13 |
WA |
Shire of Bruce Rock |
10 |
WA |
Shire of Capel |
13 |
WA |
Shire of Carnamah |
7 |
WA |
Shire of Carnarvon |
15 |
WA |
Shire of Chapman Valley |
12 |
WA |
Shire of Chittering |
18 |
WA |
Shire of Collie |
20 |
WA |
Shire of Coolgardie |
9 |
WA |
Shire of Coorow |
10 |
WA |
Shire of Corrigin |
12 |
WA |
Shire of Cranbrook |
13 |
WA |
Shire of Cuballing |
10 |
WA |
Shire of Cue |
2 |
WA |
Shire of Cunderdin |
10 |
WA |
Shire of Dalwallinu |
15 |
WA |
Shire of Dandaragan |
23 |
WA |
Shire of Dardanup |
12 |
WA |
Shire of Denmark |
25 |
WA |
Shire of Derby-West Kimberley |
20 |
WA |
Shire of Donnybrook-Balingup |
27 |
WA |
Shire of Dowerin |
8 |
WA |
Shire of Dumbleyung |
10 |
WA |
Shire of Dundas |
4 |
WA |
Shire of East Pilbara |
27 |
WA |
Shire of Esperance |
42 |
WA |
Shire of Exmouth |
6 |
WA |
Shire of Gingin |
37 |
WA |
Shire of Gnowangerup |
13 |
WA |
Shire of Goomalling |
10 |
WA |
Shire of Halls Creek |
10 |
WA |
Shire of Harvey |
30 |
WA |
Shire of Irwin |
13 |
WA |
Shire of Jerramungup |
13 |
WA |
Shire of Katanning |
13 |
WA |
Shire of Kellerberrin |
9 |
WA |
Shire of Kent |
10 |
WA |
Shire of Kojonup |
20 |
WA |
Shire of Kondinin |
11 |
WA |
Shire of Koorda |
6 |
WA |
Shire of Kulin |
12 |
WA |
Shire of Lake Grace |
20 |
WA |
Shire of Laverton |
5 |
WA |
Shire of Leonora |
9 |
WA |
Shire of Manjimup |
42 |
WA |
Shire of Meekatharra |
8 |
WA |
Shire of Menzies |
3 |
WA |
Shire of Merredin |
15 |
WA |
Shire of Mingenew |
6 |
WA |
Shire of Moora |
18 |
WA |
Shire of Morawa |
9 |
WA |
Shire of Mount Magnet |
3 |
WA |
Shire of Mount Marshall |
10 |
WA |
Shire of Mukinbudin |
7 |
WA |
Shire of Mundaring |
101 |
WA |
Shire of Murchison |
3 |
WA |
Shire of Murray |
95 |
WA |
Shire of Nannup |
10 |
WA |
Shire of Narembeen |
11 |
WA |
Shire of Narrogin |
16 |
WA |
Shire of Ngaanyatjarraku |
3 |
WA |
Shire of Northam |
38 |
WA |
Shire of Northampton |
21 |
WA |
Shire of Nungarin |
3 |
WA |
Shire of Peppermint Grove |
1 |
WA |
Shire of Perenjori |
11 |
WA |
Shire of Pingelly |
9 |
WA |
Shire of Plantagenet |
34 |
WA |
Shire of Quairading |
10 |
WA |
Shire of Ravensthorpe |
16 |
WA |
Shire of Sandstone |
2 |
WA |
Shire of Serpentine-Jarrahdale |
111 |
WA |
Shire of Shark Bay |
3 |
WA |
Shire of Tammin |
4 |
WA |
Shire of Three Springs |
7 |
WA |
Shire of Toodyay |
28 |
WA |
Shire of Trayning |
5 |
WA |
Shire of Upper Gascoyne |
4 |
WA |
Shire of Victoria Plains |
13 |
WA |
Shire of Wagin |
12 |
WA |
Shire of Wandering |
6 |
WA |
Shire of Waroona |
14 |
WA |
Shire of West Arthur |
13 |
WA |
Shire of Westonia |
5 |
WA |
Shire of Wickepin |
8 |
WA |
Shire of Williams |
10 |
WA |
Shire of Wiluna |
5 |
WA |
Shire of Wongan-Ballidu |
13 |
WA |
Shire of Woodanilling |
5 |
WA |
Shire of Wyalkatchem |
6 |
WA |
Shire of Wyndham-East Kimberley |
21 |
WA |
Shire of Yalgoo |
4 |
WA |
Shire of Yilgarn |
14 |
WA |
Shire of York |
23 |
WA |
Town of Bassendean |
10 |
WA |
Town of Cambridge |
22 |
WA |
Town of Claremont |
5 |
WA |
Town of Cottesloe |
4 |
WA |
Town of East Fremantle |
4 |
WA |
Town of Mosman Park |
4 |
WA |
Town of Port Hedland |
6 |
WA |
Town of Victoria Park |
18 |
Total |
18,494 |
^ Location names are derived from intersection with the most recent Local Government Area dataset.
Spatial files of the updated areas are available upon request via support@geoscape.com.au.
Change Notifications
National Buildings and Solar Refresh in Rural Areas
The June 2026 release includes a national refresh of rural areas across both the National Buildings and National Solar products, advancing Geoscape’s approach to maintaining currency, consistency and completeness across non-urban Australia. This change has resulted in a minor version change for each of these products.
Building on the National Buildings 4.0 foundation introduced in March, this update leverages newly sourced high-resolution satellite imagery (30 cm) to recapture and validate building features across rural and regional areas. This improved imagery enables more accurate identification of structures, supporting the addition of previously missing buildings and the refinement of existing features. The June 2026 update focussed on refreshing locations known to have buildings, with further updates planned later in the year to identify new construction locations not currently covered in the Buildings dataset.
Satellite update highlights
~824,000 newly detected buildings added
71% of satellite buildings are captured from imagery dated 2025 onwards, improving building currency across rural Australia
As part of this refinement, there is a net decrease in the total number of rural building features. Improved capture and classification processes have enabled more precise filtering of features, removing objects that do not meet the definition of a building within the National Buildings product, such as water tanks, silos and netted agricultural areas. This results in a more consistent and reliable representation of the built environment.
While the update introduces a large number of newly captured buildings, it also consolidates and removes superseded features.
Building footprint refinement
~19.14 million buildings in the current release
~19.50 million buildings in the previous release
Net reduction of ~360,000 buildings, reflecting improved accuracy and alignment to current building definitions
Note: Any features removed across these areas in the June 2026 release can be provided on request.
The updated capture has also improved attribute completeness and usability within the National Buildings dataset. In particular, an increased number of features now include a Primary Building flag, supporting clearer identification of primary dwellings relative to secondary structures.
Solar attribute uplift
A key enhancement in this release is the improvement in solar panel attribute completeness:
Solar assessment coverage increased to 99% of all buildings (up from ~40%)
Significant increase in usable solar coverage across rural areas
These enhancements directly support improvements to the National Solar product. With more accurate and consistent building footprints in rural areas, solar panel detection and representation has been extended across these regions. This enables the provision of solar attributes, including panel area and estimated power generation, for buildings across rural Australia, supporting a more complete national view of the renewable energy landscape.
This release also establishes a more scalable approach to maintaining both Buildings and Solar coverage into the future. Geoscape is targeting at least annual review and update cycles using the latest available imagery, with ongoing releases continuing to prioritise areas where building and solar data coverage can be further improved.
Satellite update coverage
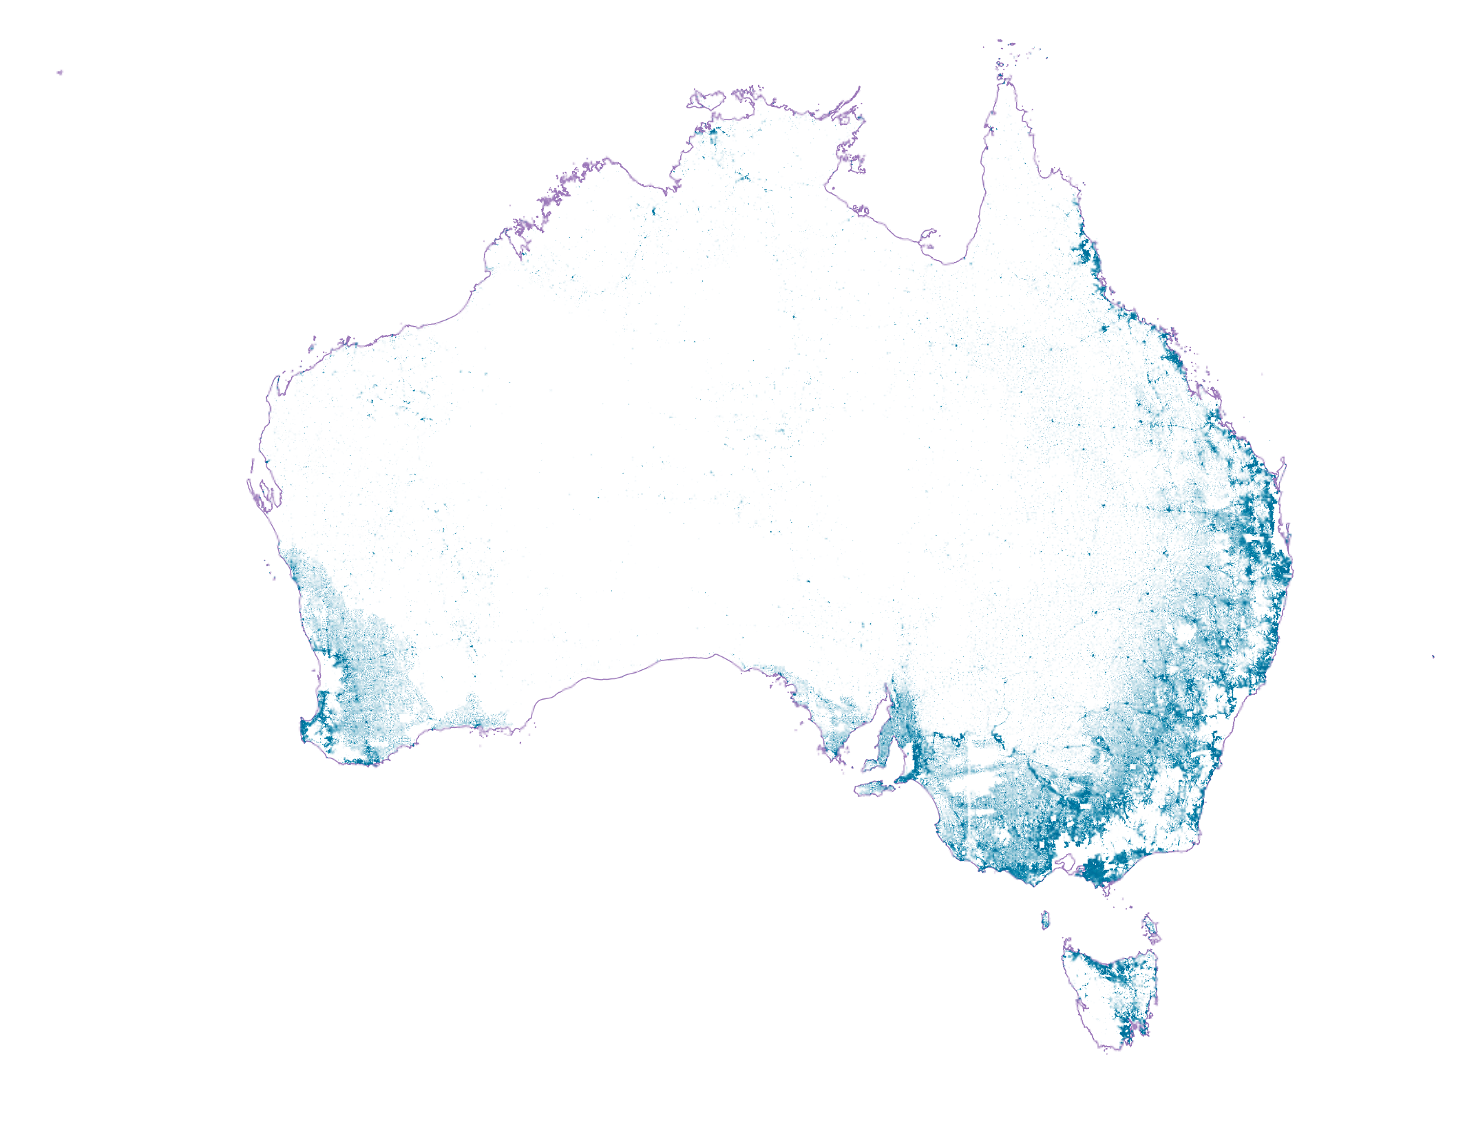
Geographic coverage of buildings captured through the June 2026 satellite update, demonstrating broad national coverage.
Approximately 62,000 buildings partially within our update areas have been retained from prior capture for completeness and therefore have not been assessed for solar panels. These locations will be included in our future update programs to recapture these buildings and their attributes from the latest imagery.
Solar Building - Rural Update Roof Attribute Population
For the June 2026 release, rural capture areas were assessed only for the roof_colour attribute for inclusion in the building_roof insights pack table related to the Buildings product. As a result, approximately 3,000,000 new records have been added to the building_roof table with a populated roof_colour value. The remaining attributes - roof_shape, primary_roof_material, roof_slope, and tree_overhang - are null, as they were not assessed during this capture. In addition, there are approximately 1,500,000 buildings within rural update areas where both roof_colour and primary_roof_material are populated, while roof_shape, roof_slope, and tree_overhang remain null. In these cases, only roof_colour was newly captured. However, primary_roof_material was already available from previous data collection and has been retained.
These changes also affect the roof attribute population in the Solar product solar_building table.
Buildings captured as part of the new rural dataset can be identified using the following attributes: - capture_resolution = ‘30cm’ - capture_method = ‘Satellite’
Building_address enhancements at complex sites
In the March 2026 release, processing changes meant that sites with multiple addresses and many large buildings were not linked, as we did not have confidence in these relationships. For example, at a site with 150 centrally located addresses and 160 dwelling-sized buildings on a single parcel, it is not possible to reliably determine which address corresponds to which building. Excluding these links also avoids a significant increase in record volume. In this scenario alone, linking all combinations would generate 24,000 building–address relationships. Including similar cases across the dataset would expand the building_address table to over 100 million records.
For the June 2026 release, we have reassessed some of these sites and have provided a link between the buildings and a single address (usually a primary address or equivalent). This logic excludes the many other addresses from linking to buildings at these sites. This allows for some representation of the site in building_address, but limits the number of introduced records. As we know that these sites contain multiple addresses, we assign all buildings that meet our size and planning zone considerations at these sites as primary_building = ‘Yes’ in building_address and primary_building_flag = ‘Yes’ in the buildings table.
Buildings at these sites will be assigned with an address_count of 1 in the buildings table as they have only been linked to a single address in the building_address table. In reality, there are more addresses present at these sites. If you require a list of affected buildings, please contact Geoscape Support.
This has affected the Solar product which also utilises these new building to address relationships.
Versioning Update (Starting June 2026)
Beginning June 2026, all data products will transition to a standardised versioning format: MAJOR-MINOR-EXTRACT (e.g., 004-000-001). This approach provides a clear and consistent structure, making it easier for users to identify product versions and understand update levels at a glance. The change is intended to improve transparency, reduce ambiguity, and support more efficient integration and usage of our data products.
Implementation of New Zip File Naming and Packaging Standards (Starting August 2026)
As part of ongoing improvements to product consistency and packaging standards, updates to zip file naming conventions and internal packaging structure will be implemented, starting in August 2026.
Zip File Naming
Two standard naming patterns will be used, depending on whether an extract contains spatial information:
Spatial Tables:
{PRODUCT-NAME}_{RELEASE YYYYMM}_{REGION}_{CRS}_{FORMAT}_{VERSION MAJOR-MINOR-EXTRACT}.zip
Aspatial (Insights) Tables:
{PRODUCT-NAME}_{RELEASE YYYYMM}_{REGION}_NODATUM_{FORMAT}_{VERSION MAJOR-MINOR-EXTRACT}.zip
Packaging Structure
All zip files will follow a simplified, flat directory layout:
No nested folders
The primary data file will be located at the top level of the zip.
Note: The product package will no longer include supporting content.txt files.
These changes ensure consistent packaging across all products, reduce complexity, and support improved automation and user experience.
Issues
New Issues
No new issues.
Resolved Issues
No resolved issues.
Known Issues
Solar polygons cut off at the edge of capture areas
Where a solar polygon is captured that crosses the edge of a capture area, the portion of the solar array that is outside will not be included in the product. This occurs in a small number of instances and will result in smaller than real-world solar_area and daily_estimated_power values.
Incorrect capture of solar polygons
Solar hot water heating, swimming pool heating and other rooftop features such as air-conditioning units can incorrectly be captured as solar polygons. These features are removed from the data where possible as they do not represent photovoltaic solar. Geoscape intends to continue to improve our processes to reduce these occurrences over time.
Solar type accuracy for low-resolution capture
Where a solar polygon is captured using imagery with resolution greater than or equal to 10cm, there is a reduction in the correctness of the solar_type classification. This often causes monocrystalline panels to be assigned with a ‘Thin-film’ solar_type value as individual panels cannot be differentiated in the imagery. Daily estimated power outputs for these records will be lower than the real-world value.
Future Considerations
This section outlines enhancements or changes under consideration, but not planned into a specific release. For further details on future initiatives, please contact Geoscape Support.
Z-values
Geoscape is considering including z-values for the solar table that would provide heights for each vertex of a solar polygon. There is potential for this information to be used to derive other attributes, such as the aspect of the solar panel.
Aspect
Geoscape is considering including an ‘aspect’ attribute that would describe the direction that the solar panel is facing. This attribute could potentially be used to improve estimates of the power generated by the solar array.
Improvements to Daily Estimated Power
Geoscape intends to further improve the daily_estimated_power attribute. For this improvement we would potentially assess the impact of the:
resolution of the imagery used to capture the solar polygon
aspect of the solar polygon
roof_shape of the building related to the solar polygon
surrounding heights of buildings, trees and other features such as mountains that could potentially shade the solar array and reduce the power output
Adjustments to this estimate will be made from the results of this assessment.
Annex A – Release Counts
Additional, retired and total National Solar counts and the percent change to the previous release have been listed in the table below.
TABLE |
ACT |
NSW |
NT |
OT |
QLD |
SA |
TAS |
VIC |
WA |
TOTAL |
|
|---|---|---|---|---|---|---|---|---|---|---|---|
solar |
Additional |
0 |
39,129 |
0 |
0 |
59,661 |
7,605 |
79,525 |
382,587 |
17,512 |
586,019 |
Retired |
0 |
9,305 |
0 |
0 |
13,654 |
0 |
0 |
247,414 |
0 |
270,373 |
|
Updated |
0 |
0 |
0 |
0 |
0 |
0 |
0 |
0 |
0 |
0 |
|
Total |
129,928 |
1,706,714 |
43,459 |
0 |
1,855,848 |
635,206 |
79,525 |
1,251,328 |
1,029,188 |
6,731,196 |
|
% Change |
0.00% |
1.78% |
0.00% |
0.00% |
2.54% |
1.21% |
100.00% |
12.11% |
1.73% |
4.92% |
|
solar_solar_address |
Total |
298,010 |
3,239,124 |
82,959 |
0 |
2,337,873 |
813,349 |
93,818 |
2,795,132 |
1,538,812 |
11,199,077 |
solar_address |
Total |
202,981 |
3,583,973 |
76,541 |
52 |
2,235,473 |
812,943 |
240,737 |
3,119,614 |
1,181,368 |
11,453,682 |
solar_building |
Total |
240,653 |
4,246,052 |
118,337 |
337 |
3,103,461 |
1,350,208 |
436,195 |
4,020,779 |
1,760,302 |
15,276,324 |