Annex A - User Guide
The Planning dataset is to be used in conjunction with Geoscape Australia’s Cadastre product to enable spatial representation and analysis.
Joining the Data
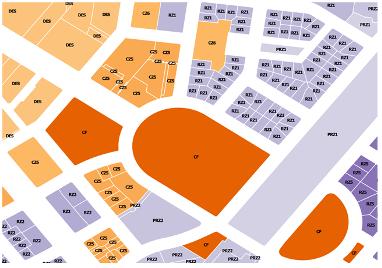
Both the cadastre_polygon_pid and cadastre_pid attributes from the Cadastre product join to the cad_polygon_pid and cad_pid attributes, respectively, from the Planning product. An example of this join for the ACT Planning data is shown in the diagram below.
![digraph G {
graph [pad="0.5", ranksep="1"];
fontname="ROBOTO" fontsize="10pt"
node [fontname="ROBOTO" fontsize="8pt"]
edge [fontname="ROBOTO" fontsize="8pt"]
rankdir=LR
act_cadastre [shape=plain
label=<<TABLE BGCOLOR="#7EA6E0"
BORDER="1"
CELLBORDER="0"
style="rounded"
CELLSPACING="0"
CELLPADDING="5">
<TR>
<TD>act_cadastre</TD>
</TR>
<TR>
<TD BGCOLOR="white" ALIGN="LEFT" >cadastre_polygon_pid</TD>
</TR>
<TR>
<TD BGCOLOR="white" ALIGN="LEFT" >cadastre_pid</TD>
</TR>
<TR>
<TD BGCOLOR="white" ALIGN="LEFT" >date_created</TD>
</TR>
<TR>
<TD BGCOLOR="white" ALIGN="LEFT" >date_modified</TD>
</TR>
<TR>
<TD BGCOLOR="white" ALIGN="LEFT" >state</TD>
</TR>
<TR>
<TD BGCOLOR="white" ALIGN="LEFT" >lot</TD>
</TR>
<TR>
<TD BGCOLOR="white" ALIGN="LEFT" >plan</TD>
</TR>
<TR>
<TD BGCOLOR="white" ALIGN="LEFT" >section</TD>
</TR>
<TR>
<TD BGCOLOR="white" ALIGN="LEFT" >parcel_id</TD>
</TR>
<TR>
<TD BGCOLOR="white" ALIGN="LEFT" >source</TD>
</TR>
<TR>
<TD BGCOLOR="white" ALIGN="LEFT" >contributor_status</TD>
</TR>
<TR>
<TD BGCOLOR="white" ALIGN="LEFT" >title_status</TD>
</TR>
<TR>
<TD BGCOLOR="white" ALIGN="LEFT" >parcel_type</TD>
</TR>
<TR>
<TD BGCOLOR="white" ALIGN="LEFT" >base_parcel</TD>
</TR>
<TR>
<TD BGCOLOR="white" ALIGN="LEFT" >strata_type</TD>
</TR>
<TR>
<TD BGCOLOR="white" ALIGN="LEFT" >total_strata_count</TD>
</TR>
<TR>
<TD BGCOLOR="white" ALIGN="LEFT" >horizontal_strata_count </TD>
</TR>
<TR>
<TD BGCOLOR="white" ALIGN="LEFT" >vertical_strata_count</TD>
</TR>
<TR>
<TD BGCOLOR="white" ALIGN="LEFT" >area:</TD>
</TR>
<TR>
<TD BGCOLOR="white" ALIGN="LEFT" >geometry</TD>
</TR>
</TABLE>>];
subgraph cluster_planning { label="Geoscape Planning"
graph[style="dashed,rounded" color="#EA6B66"]
act_planning [shape=plain
label=<<TABLE BGCOLOR="#FFD966"
BORDER="1"
CELLBORDER="0"
style="rounded"
CELLSPACING="0"
CELLPADDING="5">
<TR>
<TD>planning</TD>
</TR>
<TR>
<TD BGCOLOR="white" ALIGN="LEFT" >cad_polygon_pid</TD>
</TR>
<TR>
<TD BGCOLOR="white" ALIGN="LEFT" >cad_pid</TD>
</TR>
<TR>
<TD BGCOLOR="white" ALIGN="LEFT" >date_created</TD>
</TR>
<TR>
<TD BGCOLOR="white" ALIGN="LEFT" >state</TD>
</TR>
<TR>
<TD BGCOLOR="white" ALIGN="LEFT" >zone_code</TD>
</TR>
<TR>
<TD BGCOLOR="white" ALIGN="LEFT" >primary_zone_description</TD>
</TR>
<TR>
<TD BGCOLOR="white" ALIGN="LEFT" >secondary_zone_description. </TD>
</TR>
<TR>
<TD BGCOLOR="white" ALIGN="LEFT" >psma_description</TD>
</TR>
<TR>
<TD BGCOLOR="white" ALIGN="LEFT" >source</TD>
</TR>
<TR>
<TD BGCOLOR="white" ALIGN="LEFT" >url</TD>
</TR>
</TABLE>>];
}
inner_join [shape=plain
label=<<TABLE
CELLBORDER="0"
style="rounded">
<TR>
<TD><br/><B>Inner Join:</B><br/><br/>cadastre_polygon_pid cad_polygon_pid. <br/>
</TD>
</TR>
</TABLE>>]
act_cadastre_planning_combined [shape=plain
label=<<TABLE BGCOLOR="#7EA6E0"
BORDER="1"
CELLBORDER="0"
style="rounded"
CELLSPACING="0"
CELLPADDING="5">
<TR>
<TD>act_cadastre_planning_combined. </TD>
</TR>
<TR>
<TD BGCOLOR="white" ALIGN="LEFT" >cadastre_polygon_pid</TD>
</TR>
<TR>
<TD BGCOLOR="white" ALIGN="LEFT" >cadastre_pid</TD>
</TR>
<TR>
<TD BGCOLOR="white" ALIGN="LEFT" >date_created</TD>
</TR>
<TR>
<TD BGCOLOR="white" ALIGN="LEFT" >date_modified</TD>
</TR>
<TR>
<TD BGCOLOR="white" ALIGN="LEFT" >state</TD>
</TR>
<TR>
<TD BGCOLOR="white" ALIGN="LEFT" >lot</TD>
</TR>
<TR>
<TD BGCOLOR="white" ALIGN="LEFT" >plan</TD>
</TR>
<TR>
<TD BGCOLOR="white" ALIGN="LEFT" >section</TD>
</TR>
<TR>
<TD BGCOLOR="white" ALIGN="LEFT" >parcel_id</TD>
</TR>
<TR>
<TD BGCOLOR="white" ALIGN="LEFT" >source</TD>
</TR>
<TR>
<TD BGCOLOR="white" ALIGN="LEFT" >contributor_status</TD>
</TR>
<TR>
<TD BGCOLOR="white" ALIGN="LEFT" >title_status</TD>
</TR>
<TR>
<TD BGCOLOR="white" ALIGN="LEFT" >parcel_type</TD>
</TR>
<TR>
<TD BGCOLOR="white" ALIGN="LEFT" >base_parcel</TD>
</TR>
<TR>
<TD BGCOLOR="white" ALIGN="LEFT" >strata_type</TD>
</TR>
<TR>
<TD BGCOLOR="white" ALIGN="LEFT" >total_strata_count</TD>
</TR>
<TR>
<TD BGCOLOR="white" ALIGN="LEFT" >horizontal_strata_count </TD>
</TR>
<TR>
<TD BGCOLOR="white" ALIGN="LEFT" >vertical_strata_count</TD>
</TR>
<TR>
<TD BGCOLOR="white" ALIGN="LEFT" >area:</TD>
</TR>
<TR>
<TD BGCOLOR="white" ALIGN="LEFT" >geometry</TD>
</TR>
<TR>
<TD BGCOLOR="white" ALIGN="LEFT" >act_planning_cad_polygon_pid</TD>
</TR>
<TR>
<TD BGCOLOR="white" ALIGN="LEFT" >act_planning_cad_pid</TD>
</TR>
<TR>
<TD BGCOLOR="white" ALIGN="LEFT" >act_planning_date_created</TD>
</TR>
<TR>
<TD BGCOLOR="white" ALIGN="LEFT" >act_planning_state</TD>
</TR>
<TR>
<TD BGCOLOR="white" ALIGN="LEFT" >act_planning_zone_code</TD>
</TR>
<TR>
<TD BGCOLOR="white" ALIGN="LEFT" >act_planning_primary_zone_description</TD>
</TR>
<TR>
<TD BGCOLOR="white" ALIGN="LEFT" >act_planning_secondary_zone_description. </TD>
</TR>
<TR>
<TD BGCOLOR="white" ALIGN="LEFT" >act_planning_psma_description</TD>
</TR>
<TR>
<TD BGCOLOR="white" ALIGN="LEFT" >act_planning_source</TD>
</TR>
<TR>
<TD BGCOLOR="white" ALIGN="LEFT" >act_planning_url</TD>
</TR>
</TABLE>>]
act_cadastre -> inner_join
act_planning -> inner_join
inner_join -> act_cadastre_planning_combined
subgraph cluster_legend {
graph[style="" label="Legend" ]
legend [shape=plain
label=<<TABLE
CELLBORDER="0"
Border="0">
<TR>
<TD BGCOLOR="#7EA6E0" BORDER="1"> </TD>
<TD>Spatial Attribute Table</TD>
</TR>
<TR>
<TD BGCOLOR="#FFD966" BORDER="1"> </TD>
<TD>Textual Attribute Table</TD>
</TR>
</TABLE>>]
}
}](_images/graphviz-a74ae16ba84d64a84e1493433c01ae1c339858c9.png)
Accessing the Detailed Zone Information
The URL attribute can be used within a web browser in conjunction with the zone_code, primary_zone_description and secondary_zone_description to access more detailed information about the planning classification for a record through the local Government or State planning instrument or scheme.
Planning data for Queensland has been sourced from both State and local Government sources. For this reason, it is necessary to be aware that Queensland Planning data will contain URL values relating to local Government planning instruments/schemes where local Government planning data is available but will contain URL values relating to the State planning instrument/scheme where local Government data is not available.
To use the URL when viewing the joined data within a GIS application, select a record (highlighted red in the below example). Click the hyperlink within the URL attribute [ACT Government, 2021]. Alternatively, copy the URL value and paste into a web browser.
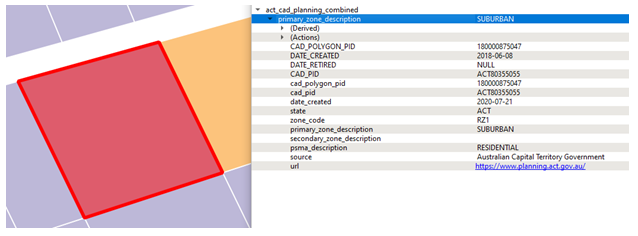
This will bring up the related State or local Government website, from which the planning instrument or scheme can be accessed. For the ACT website navigate to the Territory Plan page [ACT Government, 2023]. The zone_code, primary_zone_description and secondary_zone_description attributes can then be used to look up more detailed information relating to the planning restrictions for the selected record. This detailed information often describes the objectives for development and types of development that will be considered by the local Government authority, as well as prohibited development within the planning zone.